Red Tide and SPC: How Students Help the FWC Monitor Local Conditions
Stephanie Palomino, SPC Natural Science Professor | 11/13/2024

You’ve heard about red tide and have maybe even seen dead fish or been affected with a cough or watery eyes when it’s present at the beach. But what is it and how is SPC helping monitor its presence to keep the public informed?
What is red tide?
The microorganism responsible for red tide is Karenia brevis. When it is found at normal population levels, it is not known to cause harm to human health. When it becomes overly abundant, it can cause harm to human health and has been known to impact the state of Florida and the Gulf of Mexico.
How does SPC help?
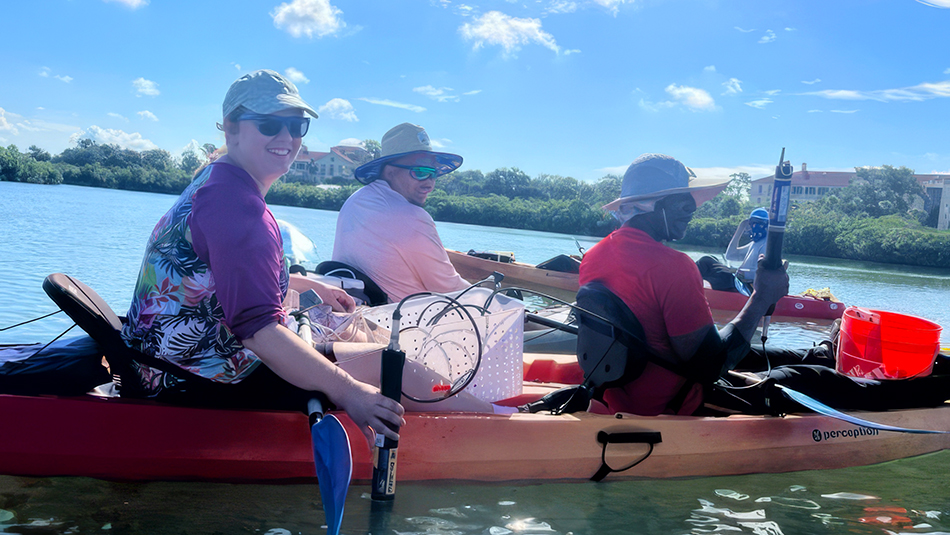
For almost two years, Dr. Stephanie Palomino and her students have been a part of the Community Scientist Red Tide Monitoring Program for Florida Fish and Wildlife Conservation Commission. Under Stephanie’s guidance, students in her Field Biology and Environmental Sampling courses monitor water quality at SPC’s Bay Pines STEM Center Lagoon located within Boca Ciega Bay’s estuary.
Students have recently noticed spikes in not only red tide, but other Harmful Algal Bloom (HAB) species in our waters. Other HAB species found include a diatom (Psuedo-nitzcshia spp.) that also contain neurotoxins and can cause a wide variety of symptoms, including skin irritations and respiratory illnesses, and can lead to shellfish poisoning. Samples and recorded water quality are sent to FWC that are then analyzed and shared on their daily sample maps. This compiled data will be used in future student research to understand trends in relation to fish communities in the area.
Overall, this research not only provides students with the opportunity to get real world experience, but also contributes to the larger scientific community, providing information for the health and safety of Floridians.
Thanks to Stephanie and her students for making a difference in our community!
Learn more
For more information about FWC’s program and continual updates, check out the Daily Sample Map. The map contains the last eight days of sampling and is updated daily at 5 p.m. Click on individual dots for sampling details.
To receive e-mails about the current red tide status or other FWC updates, visit FWC’s subscription page.


